Na de univariate analyse — waarbij je elke variabele afzonderlijk bekeek — kijk je nu naar de relaties tussen variabelen.
Deze notebook behandelt:
Correlatiematrix en heatmap
Scatter plot per categorie
Boxplot van numerieke variabele per categorische variabele
Pairplot voor een globaal overzicht
Multicollineariteit opsporen
We werken verder met de Titanic-dataset.
import matplotlib.pyplot as plt
import numpy as np
import pandas as pd
import plotly.express as px
import seaborn as sns

sns.set_theme(style="whitegrid")

df = sns.load_dataset("titanic").copy()

# Basic cleaning: fill missing ages with median
df["age"] = df["age"].fillna(df["age"].median())

df.head()Correlatiematrix
De correlatiecoëfficiënt (Pearson) meet de lineaire samenhang tussen twee numerieke variabelen:
+1: perfecte positieve correlatie
0: geen lineaire correlatie
−1: perfecte negatieve correlatie
⚠️ Correlatie ≠ causaliteit!
# Select numeric columns and compute correlation matrix
numeric_cols = df.select_dtypes(include="number")
corr = numeric_cols.corr().round(2)
print(corr)
survived pclass age sibsp parch fare
survived 1.00 -0.34 -0.06 -0.04 0.08 0.26
pclass -0.34 1.00 -0.34 0.08 0.02 -0.55
age -0.06 -0.34 1.00 -0.23 -0.17 0.10
sibsp -0.04 0.08 -0.23 1.00 0.41 0.16
parch 0.08 0.02 -0.17 0.41 1.00 0.22
fare 0.26 -0.55 0.10 0.16 0.22 1.00
# Visualise as a heatmap
fig, ax = plt.subplots(figsize=(7, 5))
mask = np.triu(np.ones_like(corr, dtype=bool))  # hide upper triangle (duplicates)

sns.heatmap(
    corr,
    mask=mask,
    annot=True,
    fmt=".2f",
    cmap="coolwarm",
    vmin=-1,
    vmax=1,
    linewidths=0.5,
    ax=ax,
)
ax.set_title("Correlation matrix — Titanic")
plt.tight_layout()
plt.show()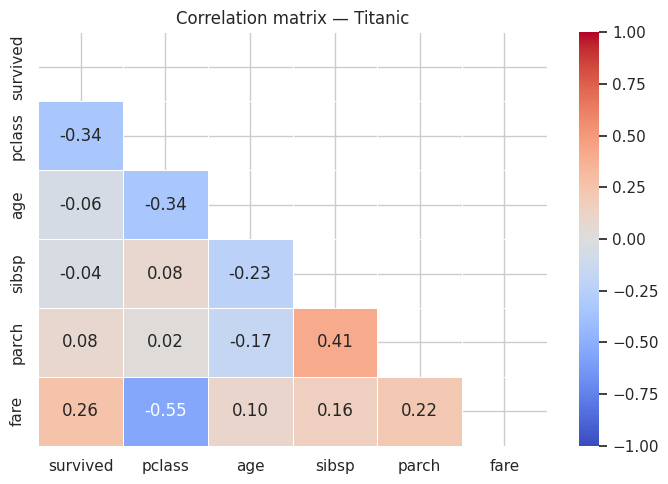
# Which variables correlate most strongly with 'survived'?
corr_survived = corr["survived"].drop("survived").abs().sort_values(ascending=False)
print("Correlation with 'survived' (absolute):")
print(corr_survived)
Correlation with 'survived' (absolute):
pclass 0.34
fare 0.26
parch 0.08
age 0.06
sibsp 0.04
Name: survived, dtype: float64
Scatter plot — relatie tussen twee numerieke variabelen
# Age vs. fare, coloured by class
fig = px.scatter(
    df,
    x="age",
    y="fare",
    color="pclass",
    opacity=0.6,
    hover_data=["sex", "survived"],
    title="Age vs. ticket price per class",
    labels={"age": "Age (years)", "fare": "Price (£)", "pclass": "Class"},
    color_continuous_scale="Viridis",
)
fig.show()Boxplot — numeriek per categorie
fig, axes = plt.subplots(1, 2, figsize=(12, 5))

# Age per class
sns.boxplot(data=df, x="pclass", y="age", ax=axes[0])
axes[0].set_title("Age per class")
axes[0].set_xlabel("Class")
axes[0].set_ylabel("Age (years)")

# Ticket price per class, hue on survival
sns.boxplot(data=df, x="pclass", y="fare", hue="survived", ax=axes[1])
axes[1].set_title("Ticket price per class and survival")
axes[1].set_xlabel("Class")
axes[1].set_ylabel("Price (£)")

plt.tight_layout()
plt.show()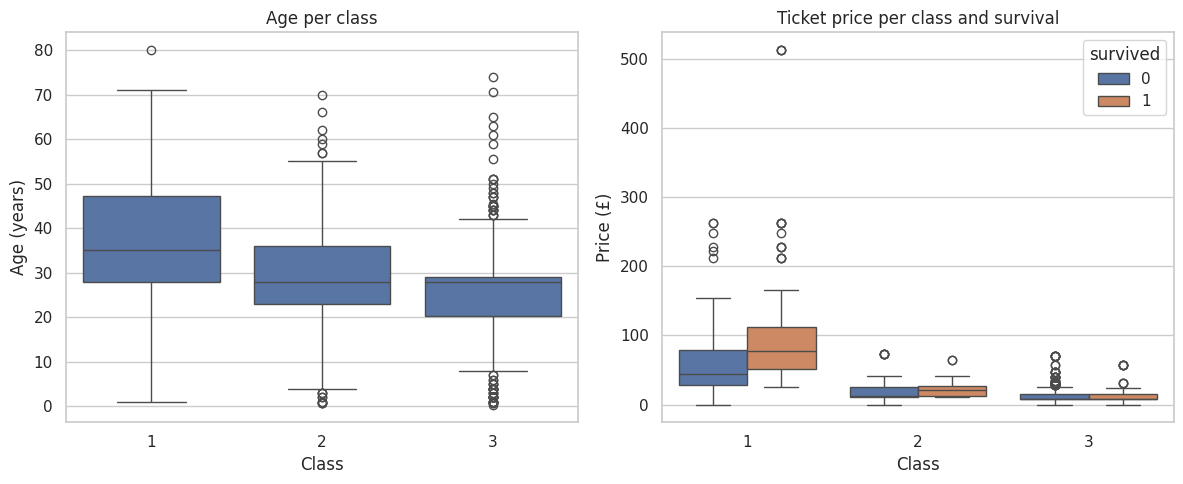
Categorische variabele vs. doelvariabele
# Survival rate by sex and class
fig, axes = plt.subplots(1, 2, figsize=(12, 4))

# Survival rate per sex
sns.barplot(data=df, x="sex", y="survived", ax=axes[0])
axes[0].set_title("Survival rate per sex")
axes[0].set_ylabel("Fraction survived")

# Survival rate per class and sex
sns.barplot(data=df, x="pclass", y="survived", hue="sex", ax=axes[1])
axes[1].set_title("Survival by class and sex")

plt.tight_layout()
plt.show()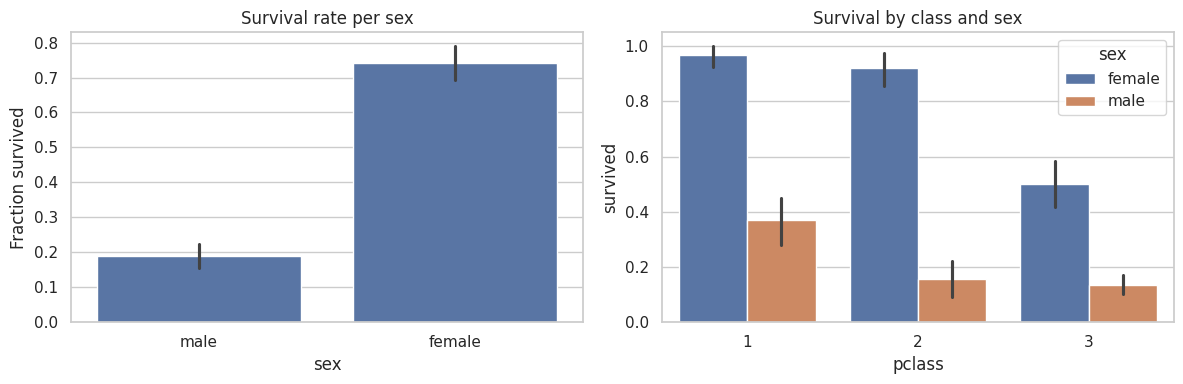
Pairplot — alle variabelen in één overzicht
# Select relevant columns for the pairplot
subset = df[["survived", "pclass", "age", "fare", "sibsp", "parch"]].copy()
subset["survived"] = subset["survived"].map({0: "no", 1: "yes"})

g = sns.pairplot(
    subset,
    hue="survived",
    plot_kws={"alpha": 0.4, "s": 15},
    diag_kind="hist",
)
g.fig.suptitle("Pairplot Titanic — colour = survived?", y=1.01)
plt.show()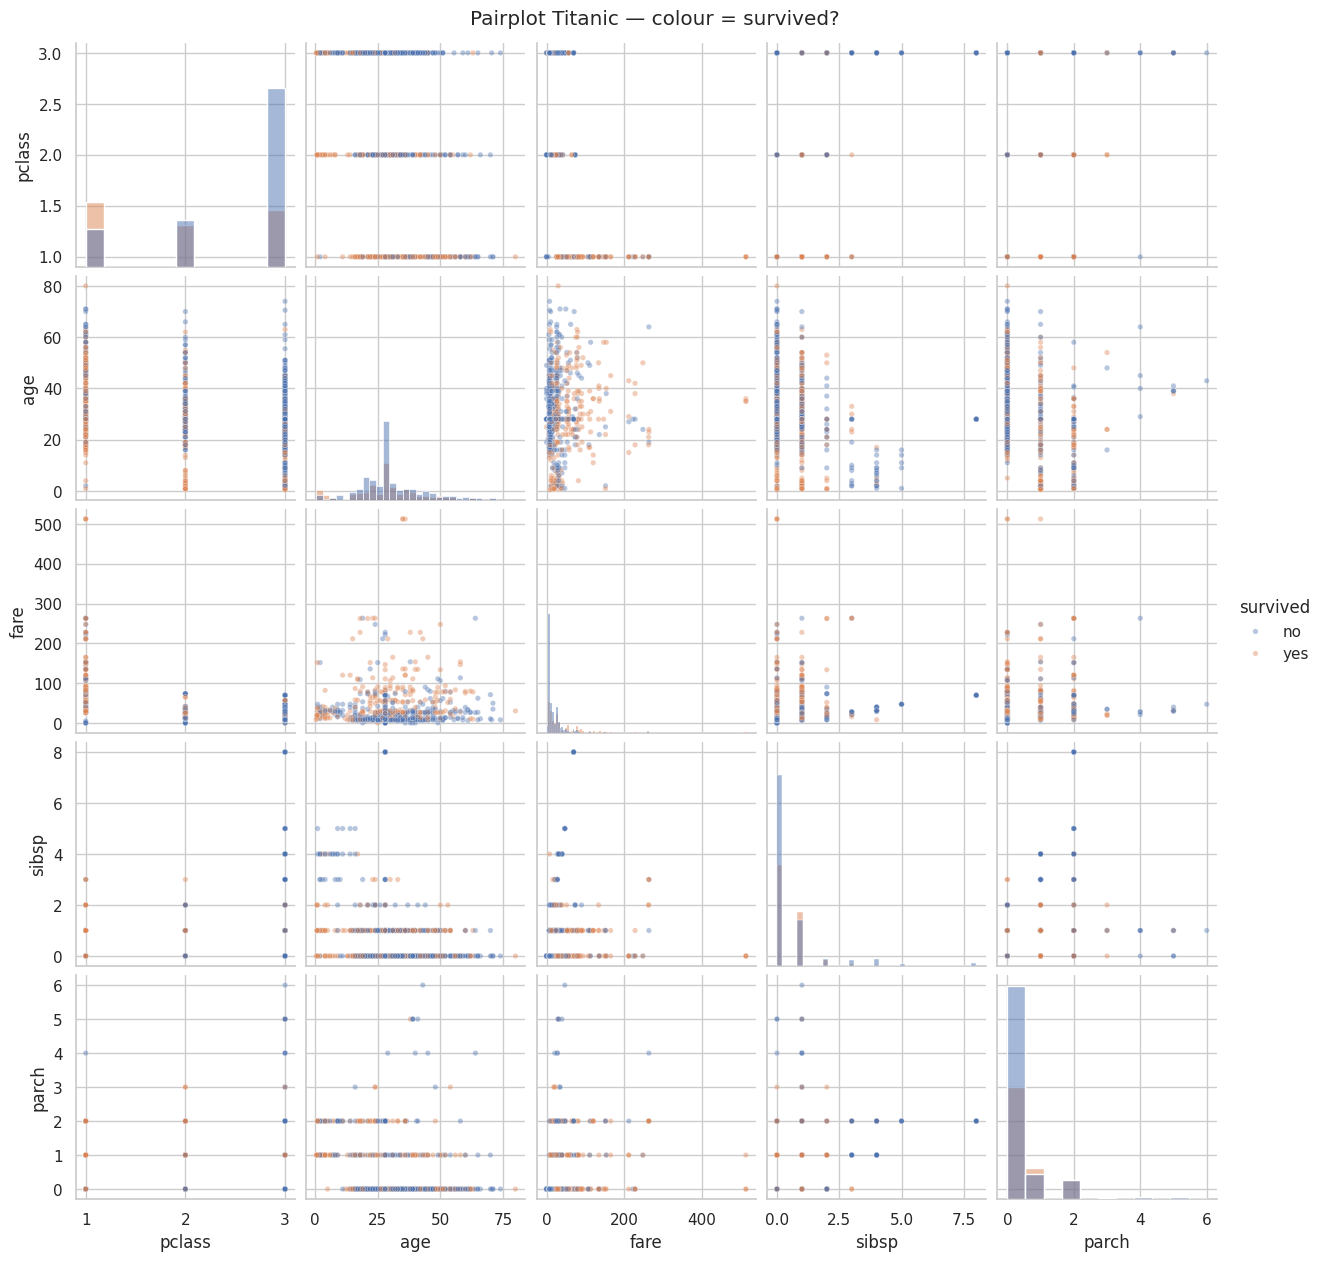
Multicollineariteit opsporen
Multicollineariteit treedt op wanneer twee variabelen sterk met elkaar correleren. Dit kan problemen geven bij bepaalde modellen. In de EDA-fase noteer je welke paren een hoge correlatie hebben (|r| > 0.5).
# Find highly correlated pairs (threshold = 0.5, excluding diagonal)
threshold = 0.5
high_corr = corr.where(np.tril(np.ones(corr.shape), k=-1).astype(bool)).stack().reset_index()
high_corr.columns = ["variable_1", "variable_2", "correlation"]
high_corr = high_corr[high_corr["correlation"].abs() > threshold].sort_values(
    "correlation", key=abs, ascending=False
)
print(high_corr.to_string(index=False))
variable_1 variable_2 correlation
fare pclass -0.55
penguins = sns.load_dataset("penguins").dropna()Oefening 1 — Bereken de correlatiematrix voor alle numerieke kolommen van de Penguins-dataset. Visualiseer als heatmap (gebruik de onderste driehoek). Welke twee variabelen zijn het sterkst gecorreleerd?
# your solution hereOefening 2 — Maak een interactieve scatter plot (Plotly) van bill_length_mm vs. body_mass_g, met kleur per species en grootte proportioneel aan flipper_length_mm. Beschrijf in een markdown-cel wat je opvalt.
# your solution hereDescription:
Oefening 3 — Maak een boxplot van body_mass_g per island, met hue="sex". Op welk eiland zijn de pinguïns het zwaarst? Is er een duidelijk verschil tussen mannetjes en vrouwtjes?
# your solution hereOefening 4 — Maak een pairplot voor de Penguins-dataset met hue="species". Identificeer in een markdown-cel:
Welk kenmerkenpaar het meest onderscheidend is voor de drie species
Welke species het meest op elkaar lijken
# your solution here